Administrator Salaries: Fast-Moving Data
By Theresa Kelly GegenJournal | July/August 2024
Notable increases, some curious numbers, and a schedule change highlight this installment of the Administrator Salaries Series, presented something-like-annually by the Illinois School Board Journal.
With data moving faster – much faster – than it did when this series started, we are moving the series to a summer issue of the Journal, so the most relevant data can be used in a timely manner. We’re catching up a bit here in hopes that the numbers are usable to school districts.
The study looks at full-time equivalent salaries (plus monetary benefits). IASB compares district superintendent salaries, assistant/associate superintendent salaries, principal and assistant principal salaries, and a catch-all of other administrators. In each category, this year we did comparisons from 2021 to 2023, and also regional comparisons. We also dove a little deeper into the often-determinative Northeast Region, especially for district superintendents.
The data in our study is as reported by the school districts to the Illinois State Board of Education as required by the Illinois School Code (105 ILCS 5/10-20.47 and 5/34-18.38). The data are publicly available and nomenclatures, including position descriptions and titles, are established by ISBE. The Journal’s work organizes the data as has been historically done in this series by year, position, and region. We once again thank ISBE for ongoing efforts to make this information available, and to the districts for providing the data.
For the purposes of this study, we remove salary data for Chicago Public Schools, for many reasons. With 320,000 students in 623 schools, it is by far the largest school district in the state and is among the top five in the nation, along with New York City, Los Angeles Unified, Miami-Dade, and Clark County (Nevada) schools. CPS also uses employment categories that Illinois’ other school districts do not, which makes comparisons difficult. We also do not use data from Illinois Department of Justice programs and independent charter schools.
As has long been the case, the regional breakdowns may prove most useful to boards of education determining salary ranges for their administrators. Within the regions, over time, we see the lows, highs, and sometimes even averages fluctuate and go against the typical trends. This is possibly due to missing data or oddities in data entry (for example, partial-year or less than full-time equivalents).
District Superintendents
For the first time in 2023, the average full-time equivalent salary (plus benefits) for Illinois district superintendents topped $200,000. This was expected, because it almost happened in with the 2022 numbers. At $205,030, the 2023 statewide average salary for district superintendents is 2.8% higher than in 2022 (See Table 1). This is a typical increase found throughout the history of the study.
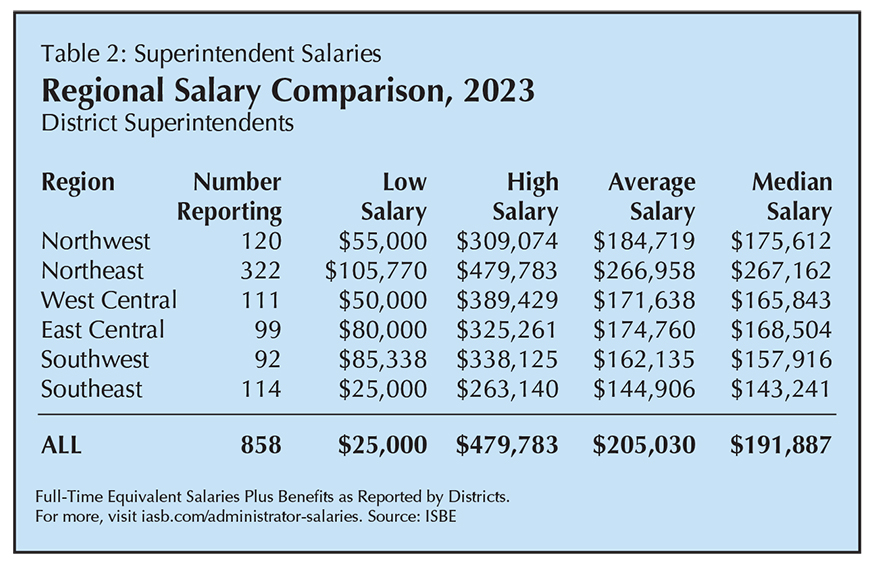
The Notable Northeast: We looked at regional averages (see Table 2) for district superintendents, to see where that increase came from. It didn’t come from the Southeast, which – after closing gaps for a few years – had a 2% lower average superintenden
 t salary in 2022 than in 2023. The Northwest region saw an increase, but less than 1%. West Central, East Central, and Southwest all saw average superintendent salary increases of 3 to 4%, as did the Northeast with its outsized influence on the overall numbers.
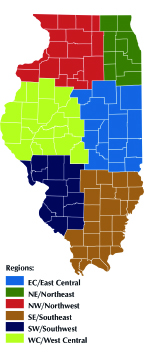
Even after removing CPS salaries from our study, the Northeast tops our charts in every category. These regions (see Figure 1) were established at the beginning of the Administrator Salaries series, over 25 years ago, and we want to be consistent with that prior work. However, for this installment of the Administrator Salaries series, we decided to further break down the numbers within the Northeast region a little further, into three subgroups: statewide, Northeast, and statewide without Northeast (See Table 2A). This offers a glance comparing the 322 district superintendent salaries in the Northeast with the 536 in the rest of the state.
We single out the Northeast because of its outsized numbers, but we don’t mean to pick on it. With both the most districts by far and the state’s highest cost of living, the higher salary numbers reflect the reality of suburban counties that surround Chicago. Note, too, that many school districts in the region span multiple counties.
One thing that stands out is that the average district superintendent salary in the Northeast, $266,958, is almost $100,000 higher than the average for the rest of the state, $167,827.
Our first subgroup is Cook County. There are more school districts – 145 – reporting from Cook than there are in any other region or subgroup. So we can safely look at Cook County school districts standing alone, without getting too into the salary weeds. Cook County’s superintendents have an average salary of $274,717, compared to $205,030 statewide.
Next, we decided to combine Lake and DuPage counties. Although these two collar counties don’t border each other, they have a lot in common. Both are considered affluent, with relatively higher costs of living, regarded school districts, and proximity to Chicago contributing to higher property values. Combining for 90 reported superintendent salaries, the average for DuPage and Lake is $288,536.
We combine the rest of the Northeast into the Far West & South suburban grouping, not to magnify any locality but to combine similar factors. McHenry, Kane, Kendall, Grundy, Will, and Kankakee counties all include both suburban and rural areas and a mix of housing options and more moderate costs of living compared to the rest of the Northeast (but still higher than the rest of the state). The Far West and South counties combine for 87 reported district superintend salaries, with an average of $231,702.
Other Regions: As noted, the average salary for district superintendents in the other five regions is $167,827 (Again, see Table 2). Outside of the Northeast, the highest average is in the Northwest, at $184,719, then East Central at $174,760 and West Central at $171,638. Then is Southwest at $162,135 and the lowest average salary for district superintendents is in the Southeast, at $144,906. There are no changes in these rankings of average salaries, but, as noted, the average in the Southeast dropped 2.3% from $148,337 in 2022 to $144,906 in 2023. In what may be a sign of long-term administrator retirements, quirks in the reporting, or a combination of both: in each region except the Northeast, the high salary from 2023 was lower than the high salary in 2022.
Assistant/Associate Superintendents
Reported salaries for assistant/associate superintendents and other administrators offer insights into the supply and demand of administrators. One might be surprised that assistant/associate superintendent salaries (see Table 3), averaging $197,564, are not that much lower than that of the district superintendents. This becomes less of a surprise when one sees that there are 387 assistant/associate superintendents in the Northeast region, and 127 in the rest of the state (See Table 4). Plus, school districts with assistant/associate superintendents tend to be larger, and therefore likely to present higher salaries. Average assistant/associate superintendent salaries went up 2.3% from 2022 to 2023.
Another note about this cohort: There were 514 assistant/associate superintendents reported in 2023, significantly more than 477 in 2022 and 467 in 2021.
Principals and Assistant Principals
One thing stands out in our comparisons of 2023 salaries to 2022 salaries, and that’s the average principal salary across the state rose by 9.3% in a year, and assistant principals’ salaries rose by 9.8%. These are the highest increases we’ve seen in the history of this series, when based on comparable data sets (See Table 5). We checked the numbers, and even accounting for normal and expected discrepancies in reporting, it does look be the case that, after a few years of smaller gains, principal salaries increased significantly in this period. The Illinois Principals Association suggests that the ongoing shortage of principals is driving the numbers up. The average salary in every region went up from 2022 to 2023, including by 10.9% in the Southwest and 10.2% in the Northwest.
As we are now familiar, the Northeast region leads the way in the number of reported principal salaries (1,591, almost half of the state’s total) and average salary of $158,429. Next in order of average salary are Northwest ($132,007), Southwest ($122,780), West Central ($119,052) East Central ($116,266), and finally, again, Southeast ($106,117).
For assistant principals, the Northeast region has 1,593 of the state’s 2,415 counted assistant principals (see Table 7). They had an average full-time equivalent salary in 2023 (see Table 8) of $129,780. Next in order of average salary are Northwest ($117,652), Southwest ($109,358), West Central ($104,217) and East Central ($98,266), and finally, again, Southeast ($96,680).
Other Administrators
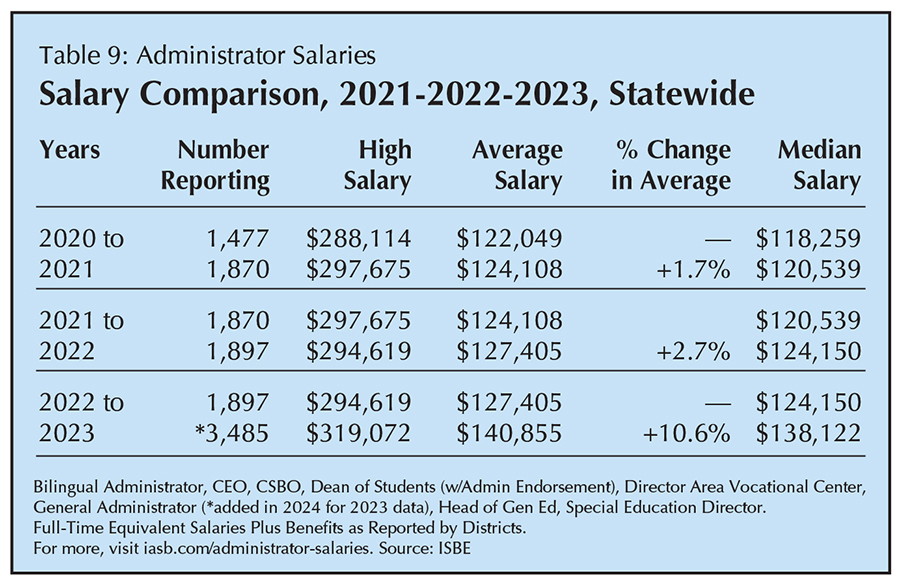
In this installment of the Administrators Salaries report, with 2023 data, we added an employment designation to our “other administrators” that we did not include previously, so comparisons between 2023 and prior years must be undertaken with care (see Table 9). Adding “General Administrator or General Supervisor” increased the numbers in this section considerably. It also added to the average salary increase by about 3%. With General Administrators the 2023 average salary for “Others” was $140,855; without them, that number was $136,103. Both were higher than 2022’s average, reported in our previous study as $127,405.
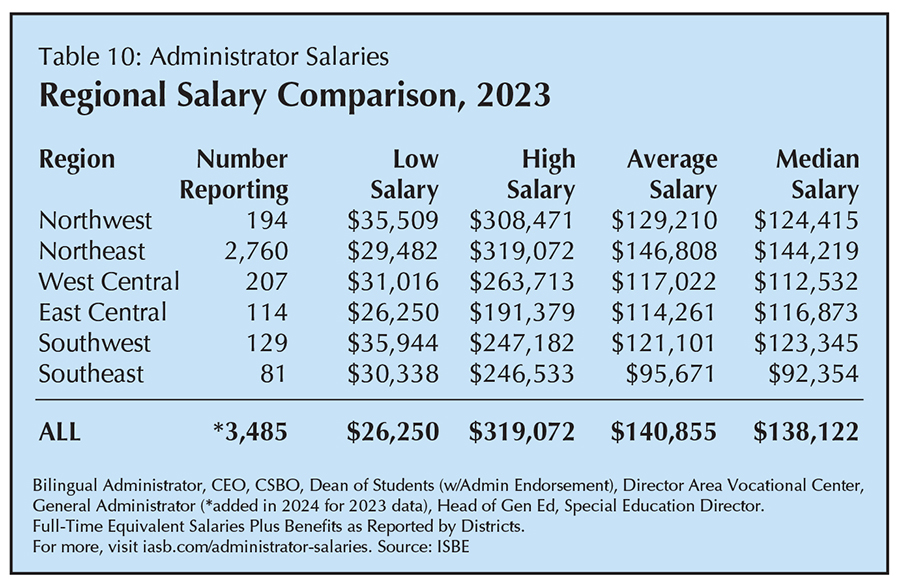
This list now includes the following: Bilingual Administrator, CEO, CSBO, Dean of Students (w/Admin Endorsement), Director Area Vocational Center, General Administrator, Head of Gen Ed, Special Education Director. And, as is always the case, the Northeast skews our numbers – 80% of the administrators in this category are in the Northeast, so we’ve provided the regional breakdown for this cohort as well (see Table 10).
Conclusion
As a whole, trends for district superintendent salaries in the 2023 data stay consistent, be it through the years, across the state, by district type, and within regions. Although a few possible explanations are available, still the increases among the other administrator salaries in 2023 warrant attention. Boards of education seeking new administrators or contracts are encouraged, once again, to look at the data relevant to them and proceed accordingly.
About the Administrator Salaries Series
Since 1997, the Illinois Association of School Boards, collaborating with researchers in the field of educational leadership, has published a report on the salaries of superintendents and principals in Illinois. Early data for the study was obtained through surveys with unaudited information collected via paper survey, with relatively low rates of return.
In 2009, a change in the law (Public Act 96-0434) required Illinois school districts to report administrator and teacher salary information to the Illinois State Board of Education (ISBE). The Illinois School Code was amended in 2011 to reflect changes in the reporting dates. The data were briefly unavailable during the transition, and the Administrator Salaries series was paused for a few years.
With reporting standards in place and the data being made available to researchers, IASB’s “annual” study of administrator salaries was revived in 2014 and 2015 with a catch-all and catch-up from those missing years, followed by a regular annual analysis. The series paused again in 2020 as the coronavirus pandemic upended the Journal’s coverage of everything, the salary data retrieval and, consequently, the series publishing. It also concluded the ability of our longtime collaborators at Western Illinois University to collaborate on the series. We are grateful for their work over the years to keep the Administrator Salaries series going. It would not be possible to continue the series today without their work in years past.
Since January 2022, IASB has presented the series in the Journal as analyzed by Editor Theresa Kelly Gegen and the Communications Department. We hope to adhere to the original standards for identifying trends, reportage, and analysis as faithfully as possible.
We’ve made one more tweak in 2024, moving the series publication date to the summer instead of the winter. This means we have two installments in 2024, but the result is an updated timeline that offers more relevant and current data, in light of the schedule by which ISBE collects and releases the information.
The full series, dating back to 1996, is available from IASB, starting a www.iasb.com/administrator-salaries.
Theresa Kelly Gegen is the Editor of the Illinois School Board Journal. Contact her at tgegen@iasb.com with questions about this series. Resources associated with this article are available at iasb.com/Journal.
Links to Tables
Table 1: District Superintendent Salaries: Salary Comparison, 2021-2022-2023, Statewide
Table 2: District Superintendent Salaries: Regional Salary Comparison, 2023
Table 2a: District Superintendent Salaries: Isolating the Northeast, 2023
Table 3: Assistant and Associate Superintendent Salaries, Salary Comparison, 2021-2022-2023, Statewide
Table 4: Assistant and Associate Superintendent Salaries, Regional Salary Comparison, 2023
Table 5: Principal Salaries, Salary Comparison, 2021-2022-2023, Statewide
Table 6: Principal Salaries, Regional Salary Comparison, 2023
Table 7: Assistant Principal Salaries, Salary Comparison, 2021-2022-2023, Statewide
Table 8: Assistant Principal Salaries, Regional Salary Comparison, 2023
Table 9: Other Administrator Salaries, Salary Comparison, 2021-2022-2023, Statewide
Table 10: Other Administrator Salaries, Regional Salary Comparison, 2023